A time-traveling full-stack test debugger

Dillon Kearns
Between Elm's purity, the full-stack Elm in The elm-pages Architecture, and the Use the Platform philosophy, the latest elm-pages release brings a new testing experience that is uniquely made possible with this convergence of design choices.
Every framework effect (BackendTasks, fetchers, cookies, redirects, ErrorPages) is a value your code returns rather than something it performs. That means your tests can swap any of them, and the debugger can inspect every state transition. It's the time-traveling debugger from early Elm, applied to your full-stack app.
You can try it out right now:
- Write a test using the new
Test.PagesProgramAPI (more info in the docs there) - Run tests headlessly with
npx elm-pages test, OR - Start your dev server with
npx elm-pages devand open uplocalhost:1234/_teststo explore them with the interactive test debugger!
Purity + Realism -> Confidence + Clarity
Purity
Early on in Elm's release, the time traveling debugger made a splash. It presented a uniquely powerful way to debug your app state, yet one that trivially and robustly fell out of The Elm Architecture. Because your Elm app is just a set of pure functions operating on immutable data, and the Elm runtime handles all of the managed effects you tell it to perform by returning Cmds, a time traveling debugger is a natural thing to build. You can even think of the timeline of events as your initial Model state from init, and then a series of changes to your Model by saving and replaying every Msg your app sends.
Your view function gives you the exact view to render given a Model state. Since init and update are pure functions, you now have a deterministic way to replay all of your app states.
Realism
With elm-pages, you are still working with pure functions, but now we are dealing with full-stack Elm apps. When you navigate to a page, a Route Module resolves its data function's BackendTask to get initial data from the server.
The key ingredients are:
data(resolved backend data that is sent to the client-sideinitfunction)- Form submissions (fetchers, all in-flight form submissions are in
app.concurrentSubmissions- after a successful form submission, thedatafunction reloads the page's data) - Cookies and signed sessions
- Redirect responses
ErrorPages
Confidence
The more that we can realistically test in our code without sacrificing speed and determinism, the better. The Test.PagesProgram API defines tests as pure functions just like a vanilla Test in Elm, so it is completely deterministic. That does mean that we can't reach out to the outside world, so no hitting your database, external HTTP service, etc. However, beyond that, you can see the realistic behavior of your elm-pages app because the cookie state, server redirect responses, etc. are all faithfully simulated in the test runner. This is the same approach that elm-program-test uses, but applied to the full-stack Elm framework features in elm-pages. We even run your app's full Vite configuration so you can see what your page will actually look like in production. Vite plays nicely with this approach because your tests and assertions remain pure, fast, and deterministic, while the visual test debugger lets you inspect those steps in a more meaningful and realistic way when you want to see what users are looking at. Headless test runs execute without running Vite.
Clarity
Now that we have highly realistic, and completely deterministic full-stack tests, what can we do with that? The purity of Elm gives us yet another benefit here. We can easily peek into the framework states at any given step.
Not only is an elm-pages test suite a great way to develop features with TDD and prevent regressions, but I would now recommend this as a great way to understand and debug your app's states and to understand the elm-pages architecture overall.
The elm-pages visual test viewer gives you several tabs that allow you to inspect the state of your app:
- Network
- Data
- Fetchers
- Cookies
- Effects
Effects as Data Are Swappable and Inspectable
In most programming languages, side effects happen directly in your code. In Elm, we pay the cost of writing pure functions, which is less convenient, but this is where that language decision really pays off. Once a side effect has been performed, you can't pause it, replay it, or inspect what happened. Elm frameworks instead let you return a special type that represents a side effect (like Cmd, BackendTask, or Review.Rule). Calling such a function doesn't directly perform the side effect, it just describes a side effect and hands it off to the framework. In production, the framework can just run that side effect when it's returned, but in a testing framework it can swap that out for different behavior. So instead of monkey-patching code to try to control the behavior in our tests, with Effects as Data we simply decide what to do in response to that data type depending on the context (production, testing, etc.).
The lamdera/program-test tool was a big inspiration for this idea that you could emulate framework behavior in pure tests. In the context of a Lamdera app, the framework-level things you can emulate are the full backend (the persistence layer is just saving an Elm type to the backend), plus Lamdera's real-time web socket communication. You can even simulate multiple connected clients to see how that affects the state in different browsers with a real-time app. This is a game-changer for understanding complex edge case behavior in Lamdera. When I first saw Martin Stewart demo this Lamdera test framework my mind was completely blown.
The key insight is that because all Elm code is pure functions, the way we model side effects is by defining data types, like BackendTask in Elm that describe but don't do side effects. That makes the job of coming in and emulating those side-effects and inspecting what is going on extremely clean for testing and debugging tools.
While there is value to testing your application all the way through the actual database queries, it is inherently prone to flakiness, slow test runs, and difficult setup. Having pure tests that give complete realism for everything but the outside world has a lot of value because they are a lot more lightweight, plus they allow you to more easily recreate specific outside world conditions in your test cases.
An Example
Let's walk through a single test to make this concrete for the examples/todo app, which is a version of the TodoMVC app but as a full-stack app with database persistence.
Optimistic UI (showing immediate UI updates before we get the roundtrip from the server confirming that the database updates landed) can be tricky to test all the edge cases. It's the perfect candidate for end-to-end testing.
Let's write a test checking what happens when we click a todo checkbox to toggle an item 3 times, THEN the resolved server response comes back. If we designed it right, we should see:
- The todo list loads, let's say it contains an incomplete item "Buy milk" (we provide a fake database response to include this item in our test)
- We click "Buy milk" 3 times, making it go from incomplete -> complete -> incomplete -> complete (fetchers still in-flight, frontend state is still optimistic about server succeeding)
- Then we say the server returns with the state saying complete and the UI lands in that final state
Note that the saveTodo function in our example code simulates a BackendTask.Custom
invocation in the production code that performs a real database query using Prisma.
suite =
    PagesProgram.test "repeats toggles on a single item"
        startAfterMagicLink
        [ finishMagicLinkLoginAndLoadTodos todosResponse
        , ensureItemsLeft 2
        , PagesProgram.group "Toggle todo 3x (optimistic)"
            [ toggleTodo "Buy milk"
            , ensureItemsLeft 1
            , toggleTodo "Buy milk"
            , ensureItemsLeft 2
            , toggleTodo "Buy milk"
            , ensureItemsLeft 1
            , PagesProgram.withinFind
                [ PSelector.tag "li"
                , PSelector.containing [ PSelector.attribute (Attr.value "Buy milk") ]
                ]
                [ PagesProgram.ensureViewHas [ PSelector.class "completed" ] ]
            ]
        , PagesProgram.group "Resolve three fetchers + reload"
            [ saveTodo { todoId = "todo-1", complete = True }
            , saveTodo { todoId = "todo-1", complete = False }
            , saveTodo { todoId = "todo-1", complete = True }
            , PagesProgram.simulateCustom "getTodosBySession" reloadedTodos
            , ensureItemsLeft 1
            , PagesProgram.withinFind
                [ PSelector.tag "li"
                , PSelector.containing [ PSelector.attribute (Attr.value "Buy milk") ]
                ]
                [ PagesProgram.ensureViewHas [ PSelector.class "completed" ] ]
            ]
        ]


toggleTodo : String -> TestApp.Step
toggleTodo description =
    PagesProgram.withinFind
        [ PSelector.tag "li"
        , PSelector.containing [ PSelector.attribute (Attr.value description) ]
        ]
        [ PagesProgram.clickButtonWith [ PSelector.class "toggle" ] ]


ensureItemsLeft : Int -> TestApp.Step
ensureItemsLeft n =
    PagesProgram.withinFind
        [ PSelector.class "todo-count" ]
        [ PagesProgram.ensureViewHas [ PSelector.text (String.fromInt n) ] ]


saveTodo : { todoId : String, complete : Bool } -> TestApp.Step
saveTodo expected =
    PagesProgram.simulateCustomWith "setTodoCompletion"
        (\args ->
            Decode.decodeValue
                (Decode.map2 (\tid c -> { todoId = tid, complete = c })
                    (Decode.field "todoId" Decode.string)
                    (Decode.field "complete" Decode.bool)
                )
                args
                |> Expect.equal (Ok expected)
        )
        Encode.null
Understanding the Test Debugger
There is a lot of information to look at, so let's break down what it all means and how to use it to understand your app state.
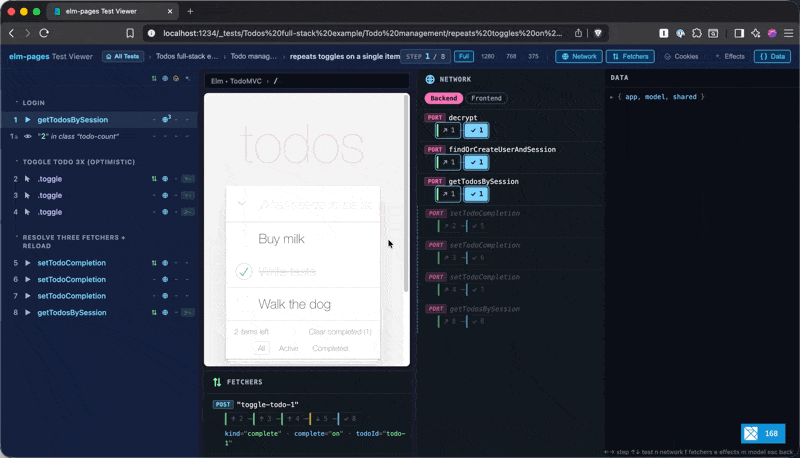
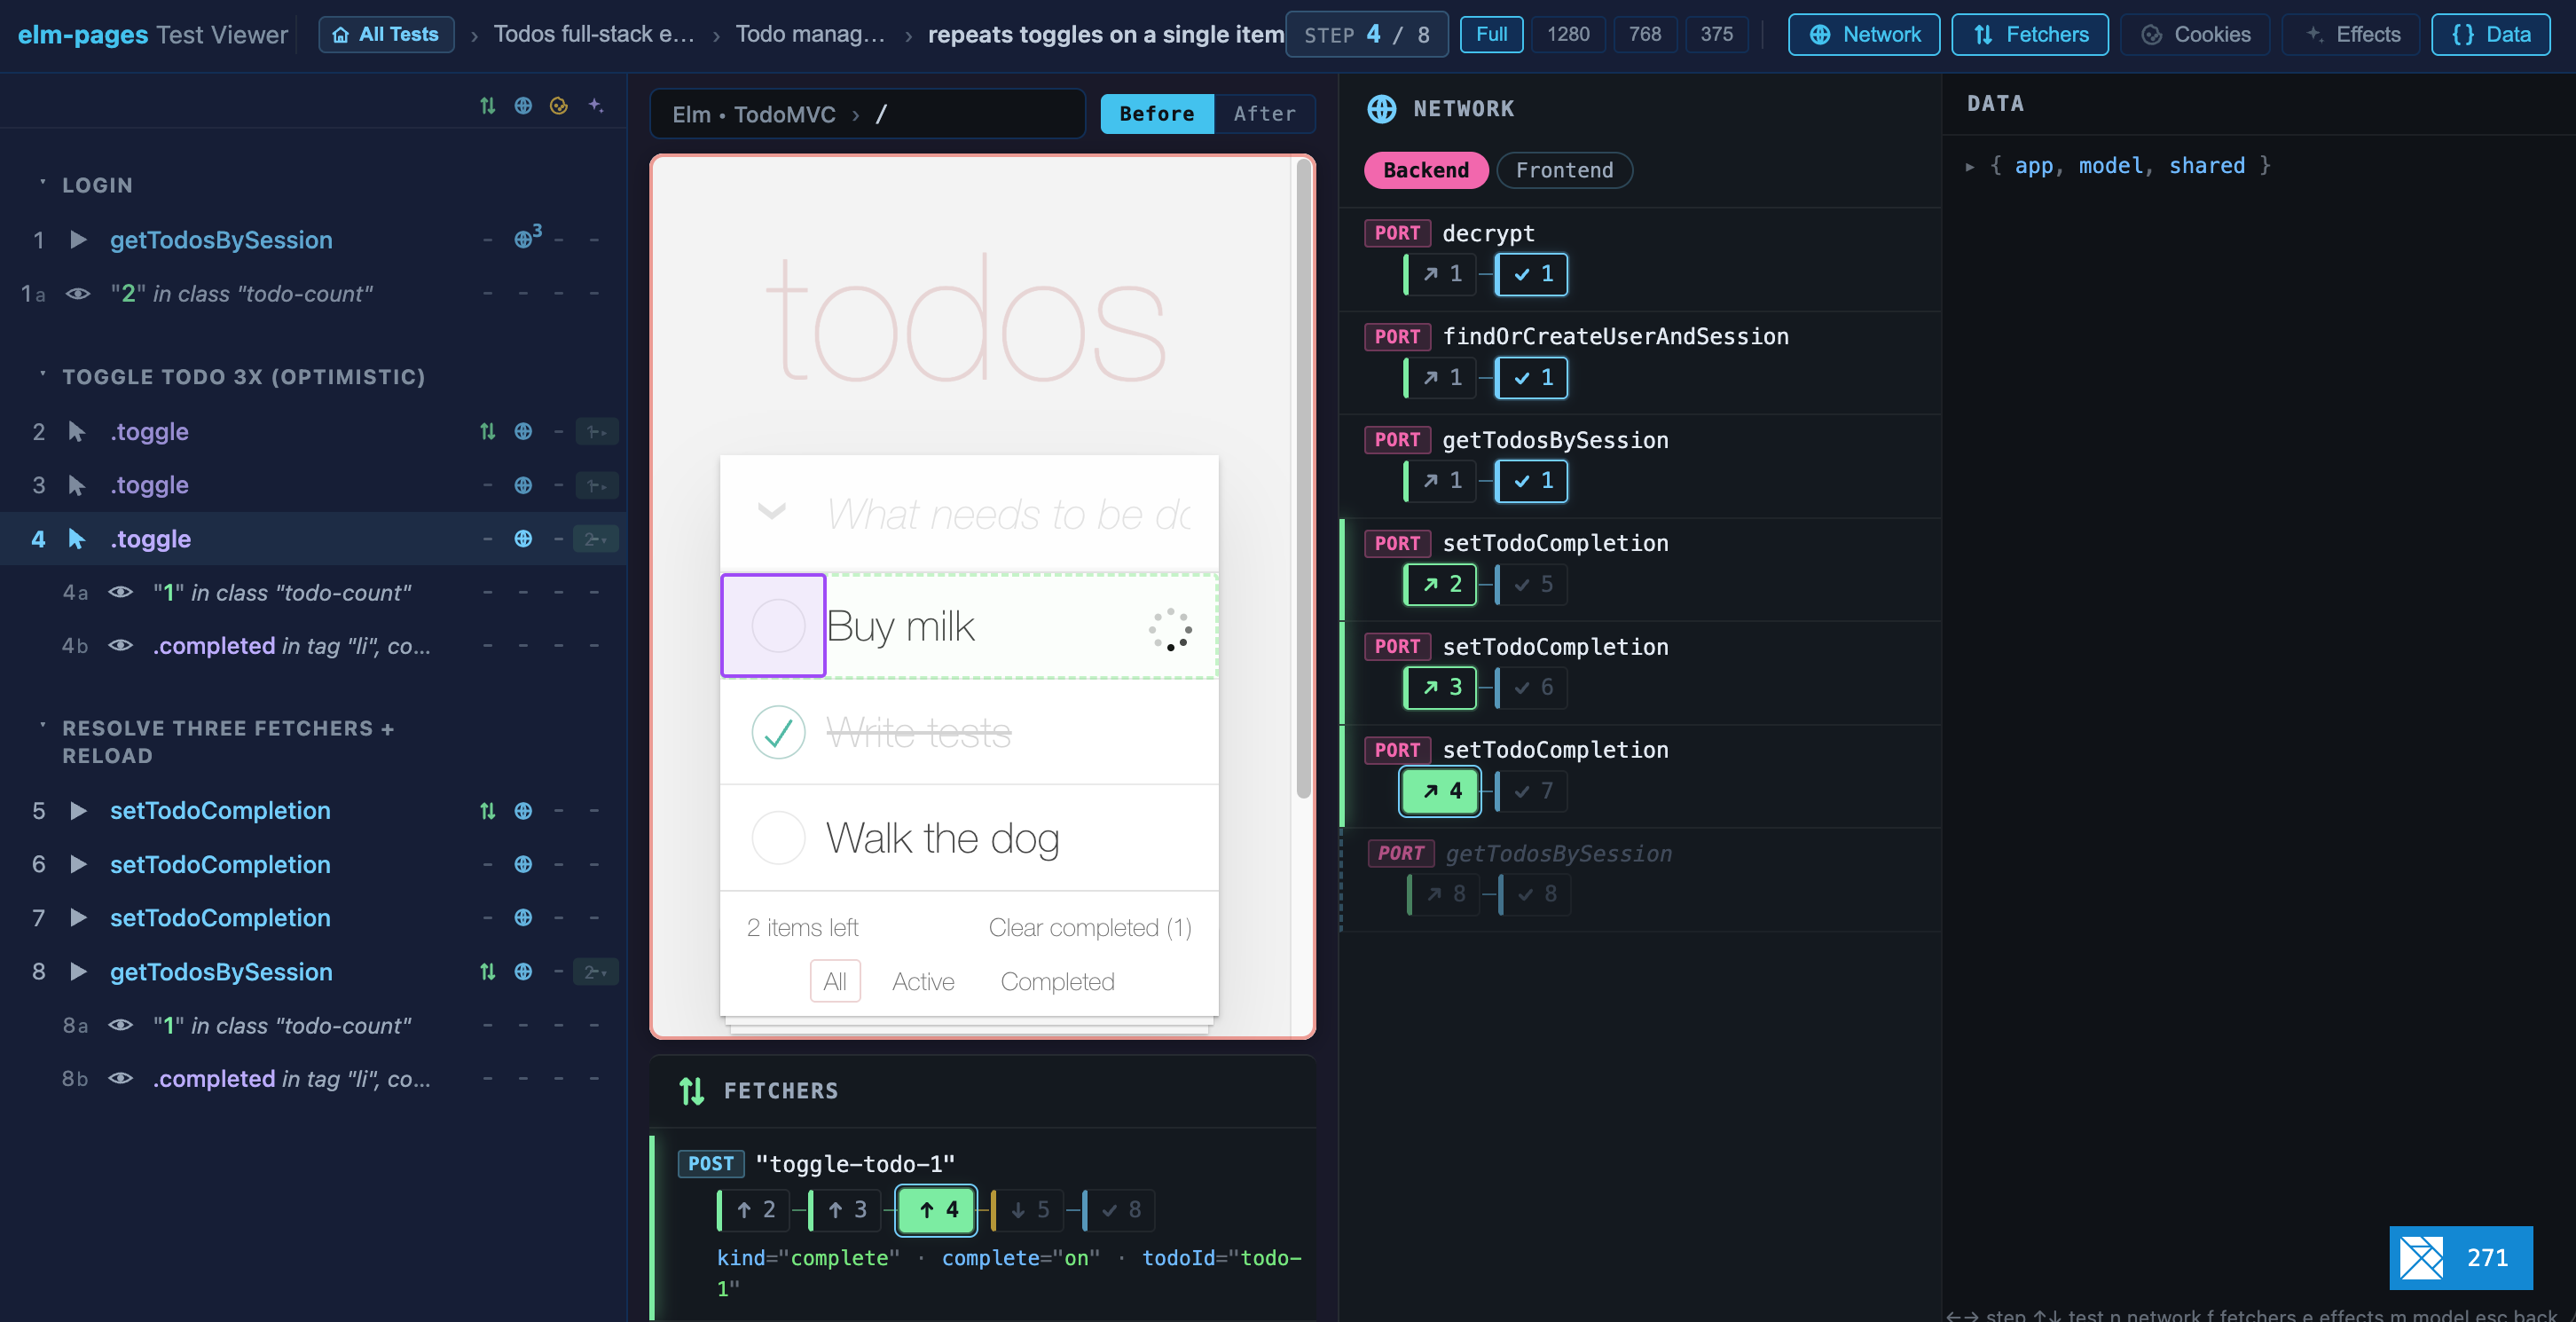
The Timeline
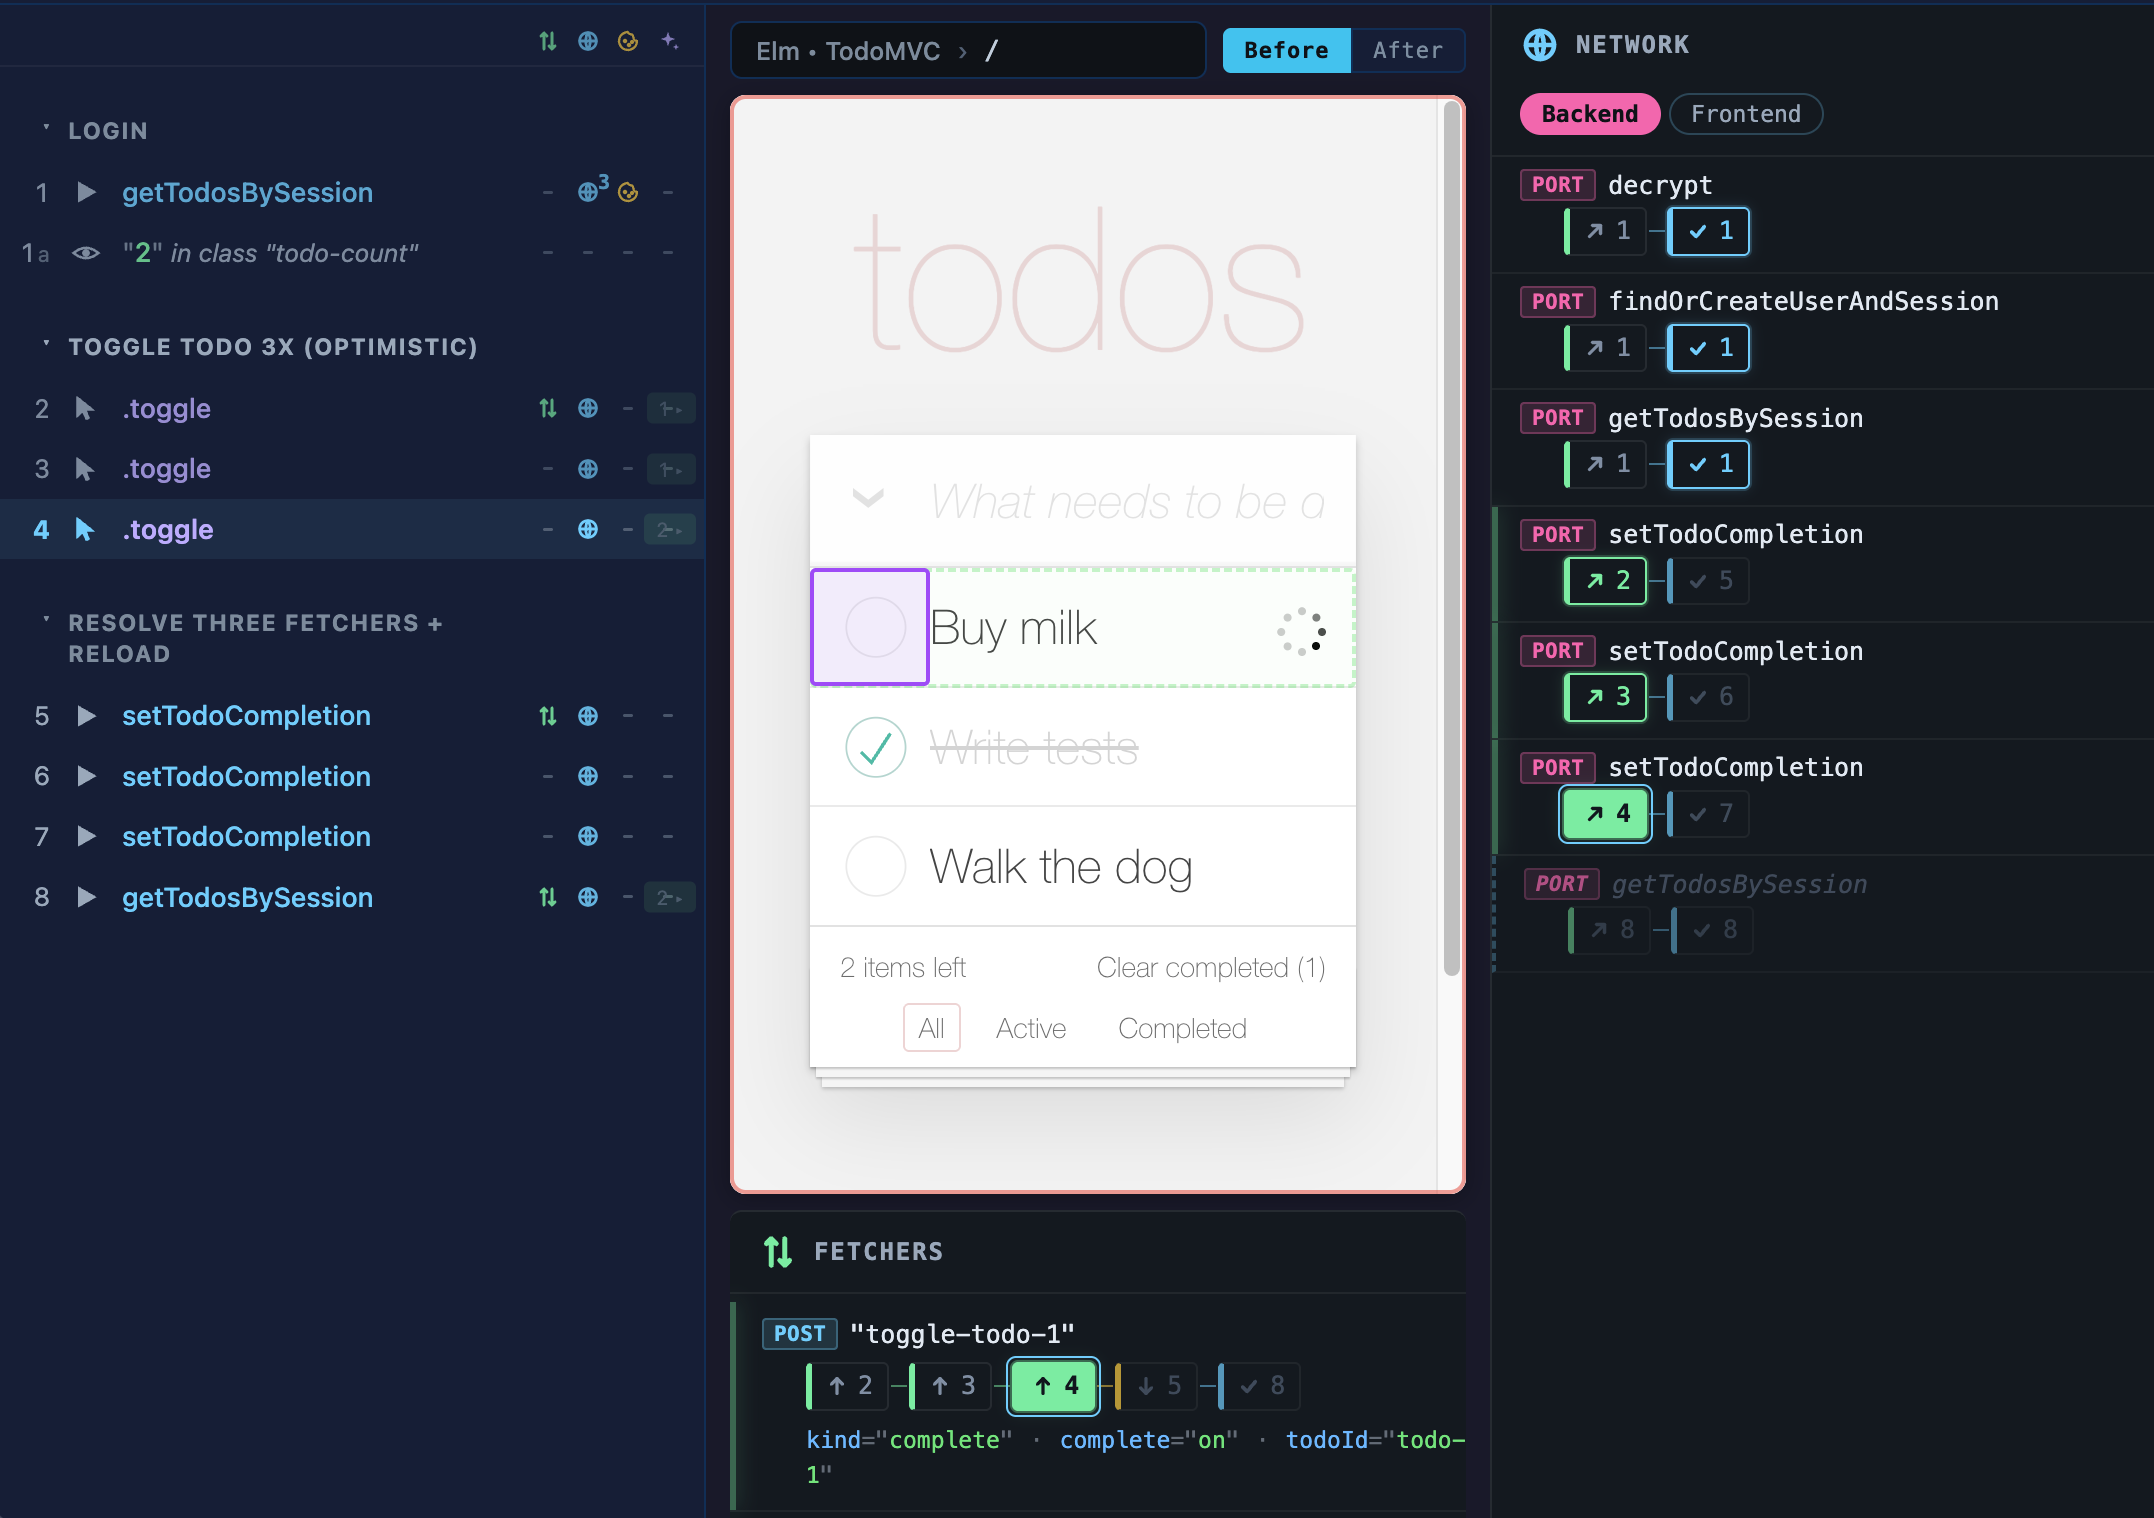
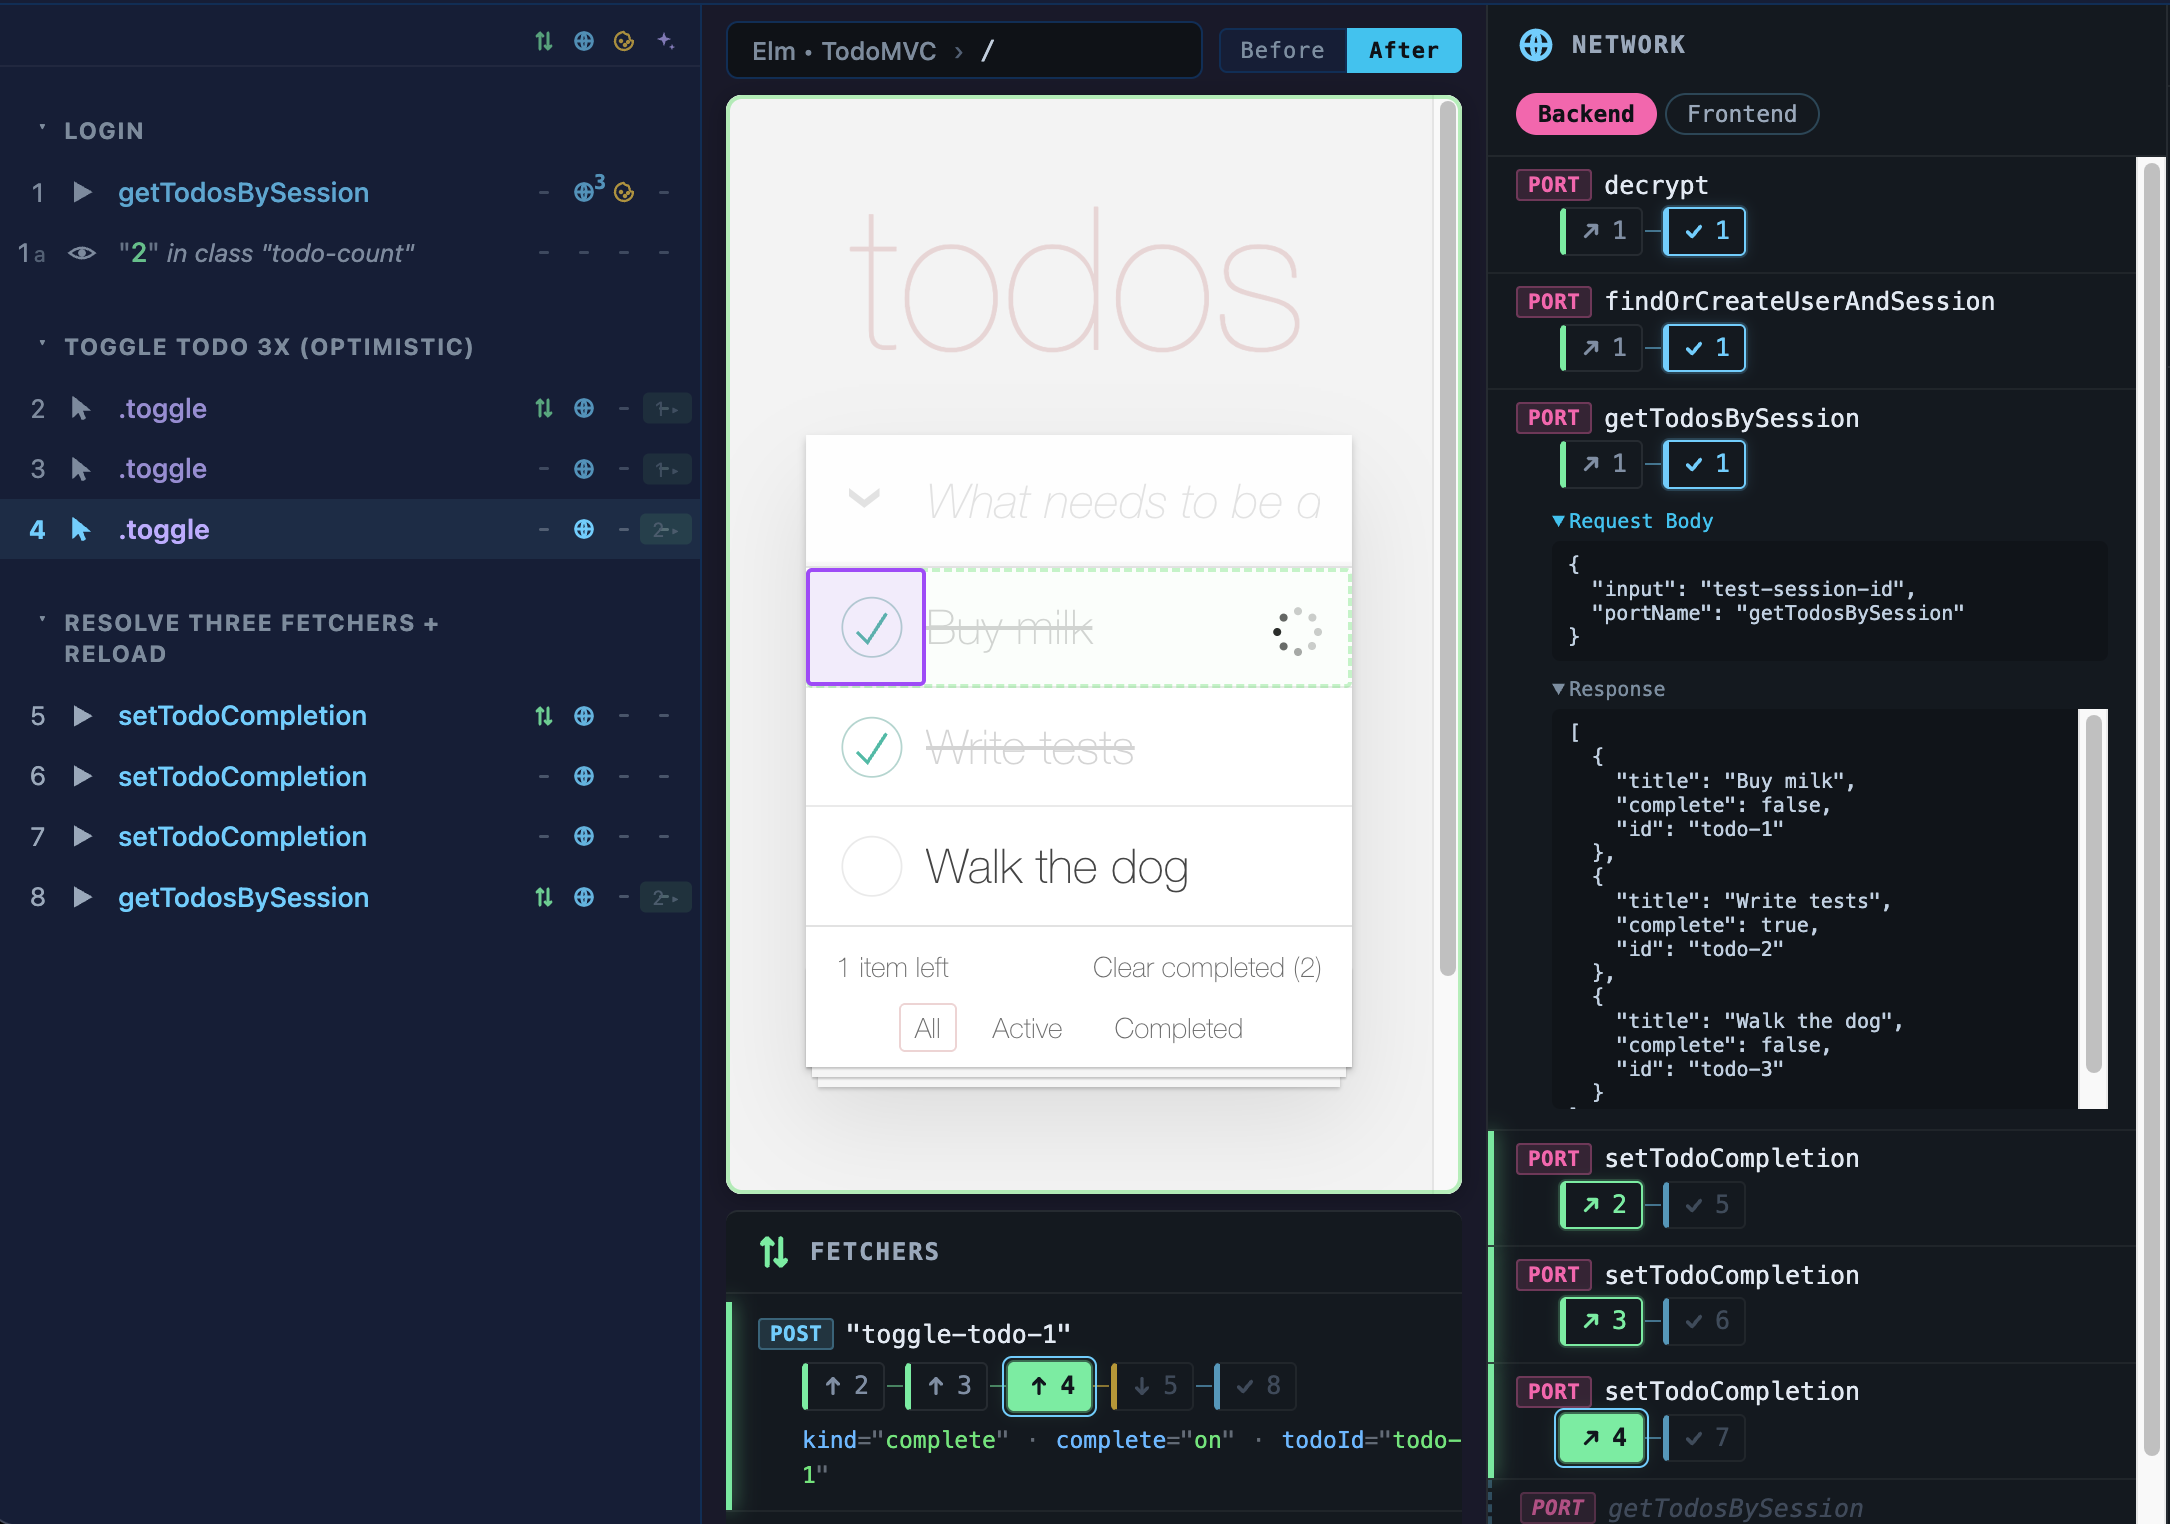
Most importantly, the steps are presented in the left sidebar. This represents a timeline of the states that your app went through over the course of this test case. Every action in your tests (typing, clicking, simulating a BackendTask resolving a pending HTTP response) results in a new step, e.g. 4. Any assertions within that get a letter within that state (4a, 4b).
Whenever there is an interaction with or assertion against a given UI element, we highlight that element in green (and purple for the item we interact with, like clicking or typing text). Step 4 is clicking the checkmark so there is a purple box around that.
Step Chips
Throughout the other tabs you will see these little boxes with numbers in them (let's call them Step Chips for short). Anywhere you see a Step Chip, you can click on it to navigate to that step in the timeline, just as if you clicked that step in the lefthand sidebar.
When a Step Chip is highlighted with a color background (4 in the screenshot from the Timeline section above), that means it is the current step you are viewing. When it is highlighted with an outline, that means it is the current state but that state began at an earlier step.
Network Tab
In the Network tab, you can see a timeline of every BackendTask (both HTTP and Custom), with the Step Chips showing when they were triggered and when they landed.
You can click on a request to inspect the HTTP request and response bodies and headers.
Fetchers Tab
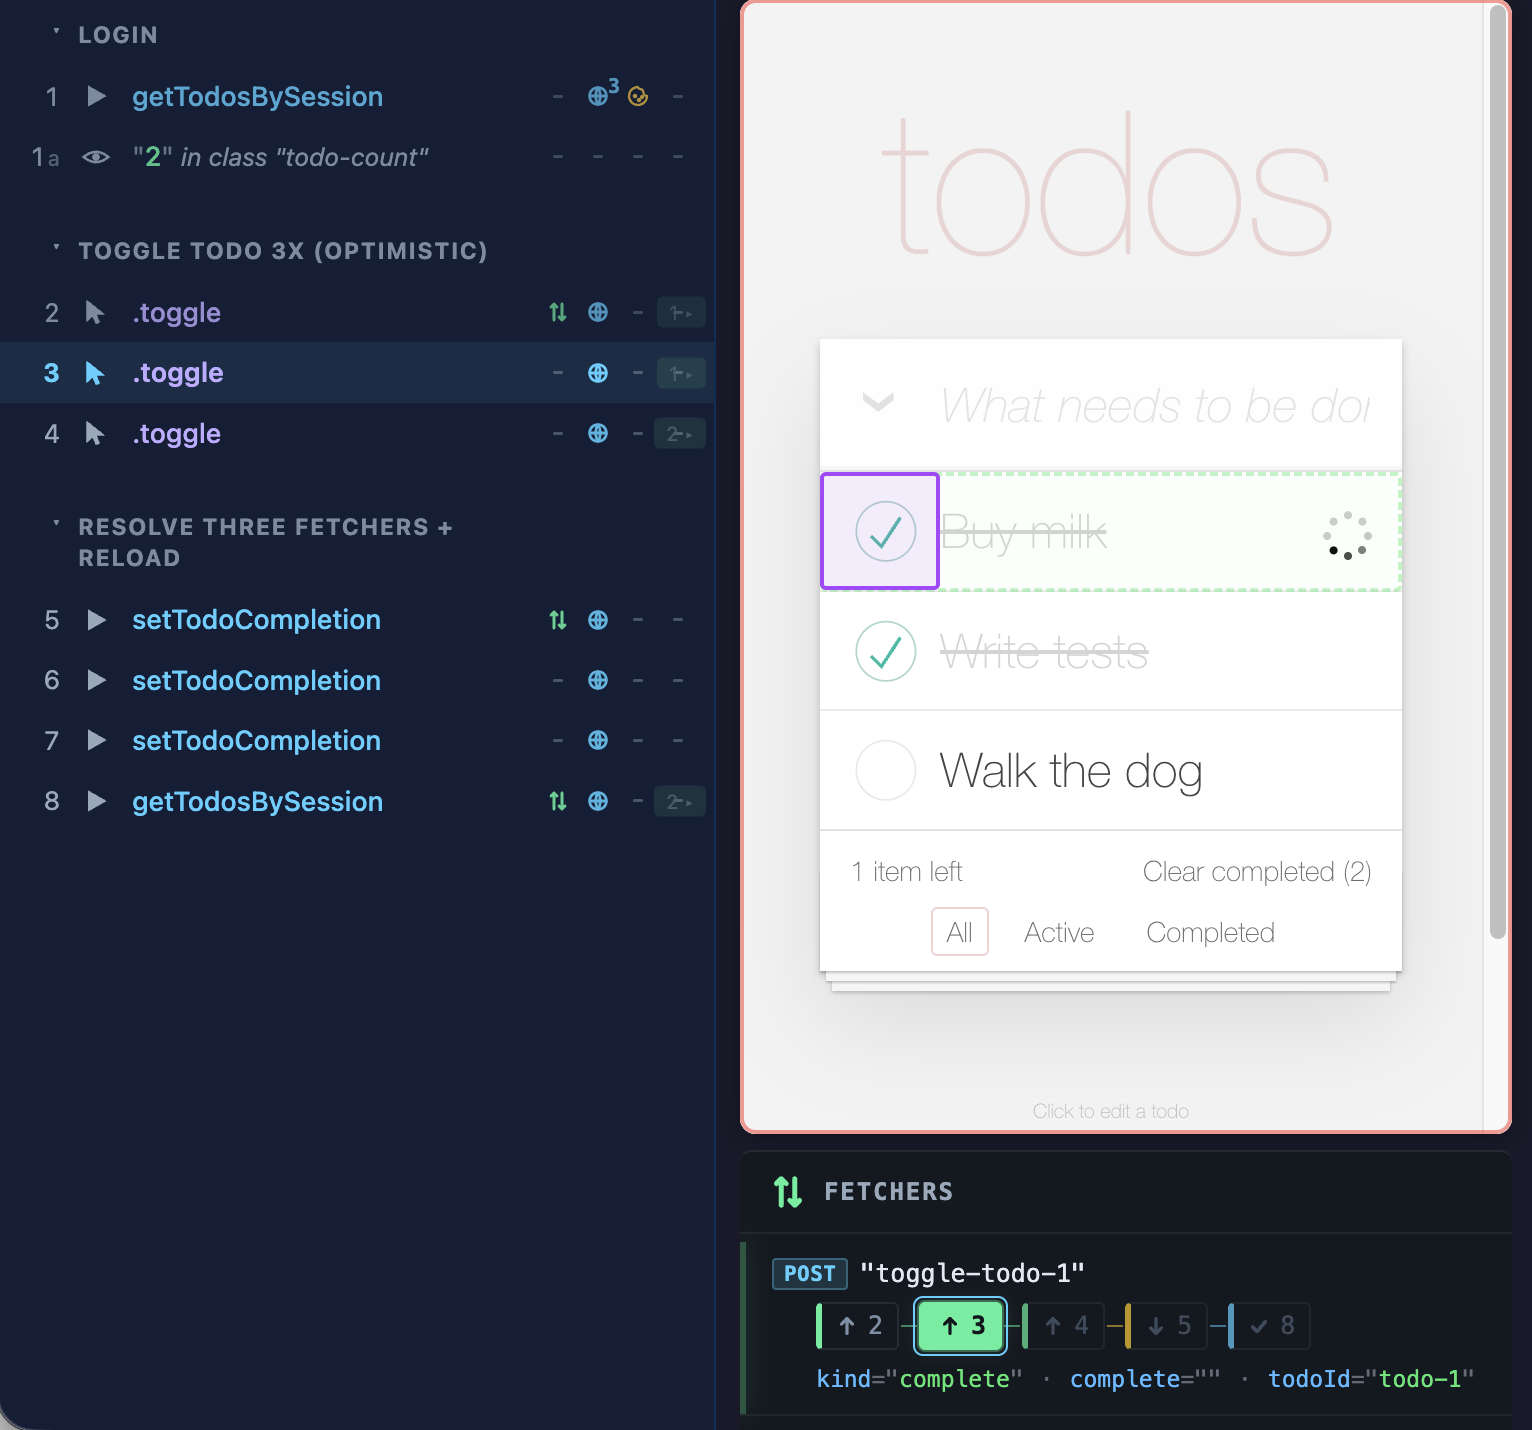
The Fetchers are the most important state for our optimistic UI. In the case of our todo item toggling its completion status, you can see that each step where we click (2, 3, 4) has a corresponding fetcher Step Chip with an up arrow. This means that the fetcher is submitting form data at that step. You can see the payload it is submitting underneath the Step Chips, and it changes as we click.
In this screenshot in Step 3, we are re-triggering the fetcher, and in our app we render a spinner for todo items that have an in-flight fetcher which we can easily inspect to ensure it is working correctly by walking through each stage of this fetcher's lifecycle.
Note that complete="on" and complete="" may seem like odd choices to serialize complete=true and complete=false. But this is just the standard format for form-encoded data for checkboxes. The nice thing here is that if we turn off JavaScript in our browser this submission will still work and the server understands it!
Cookies Tab
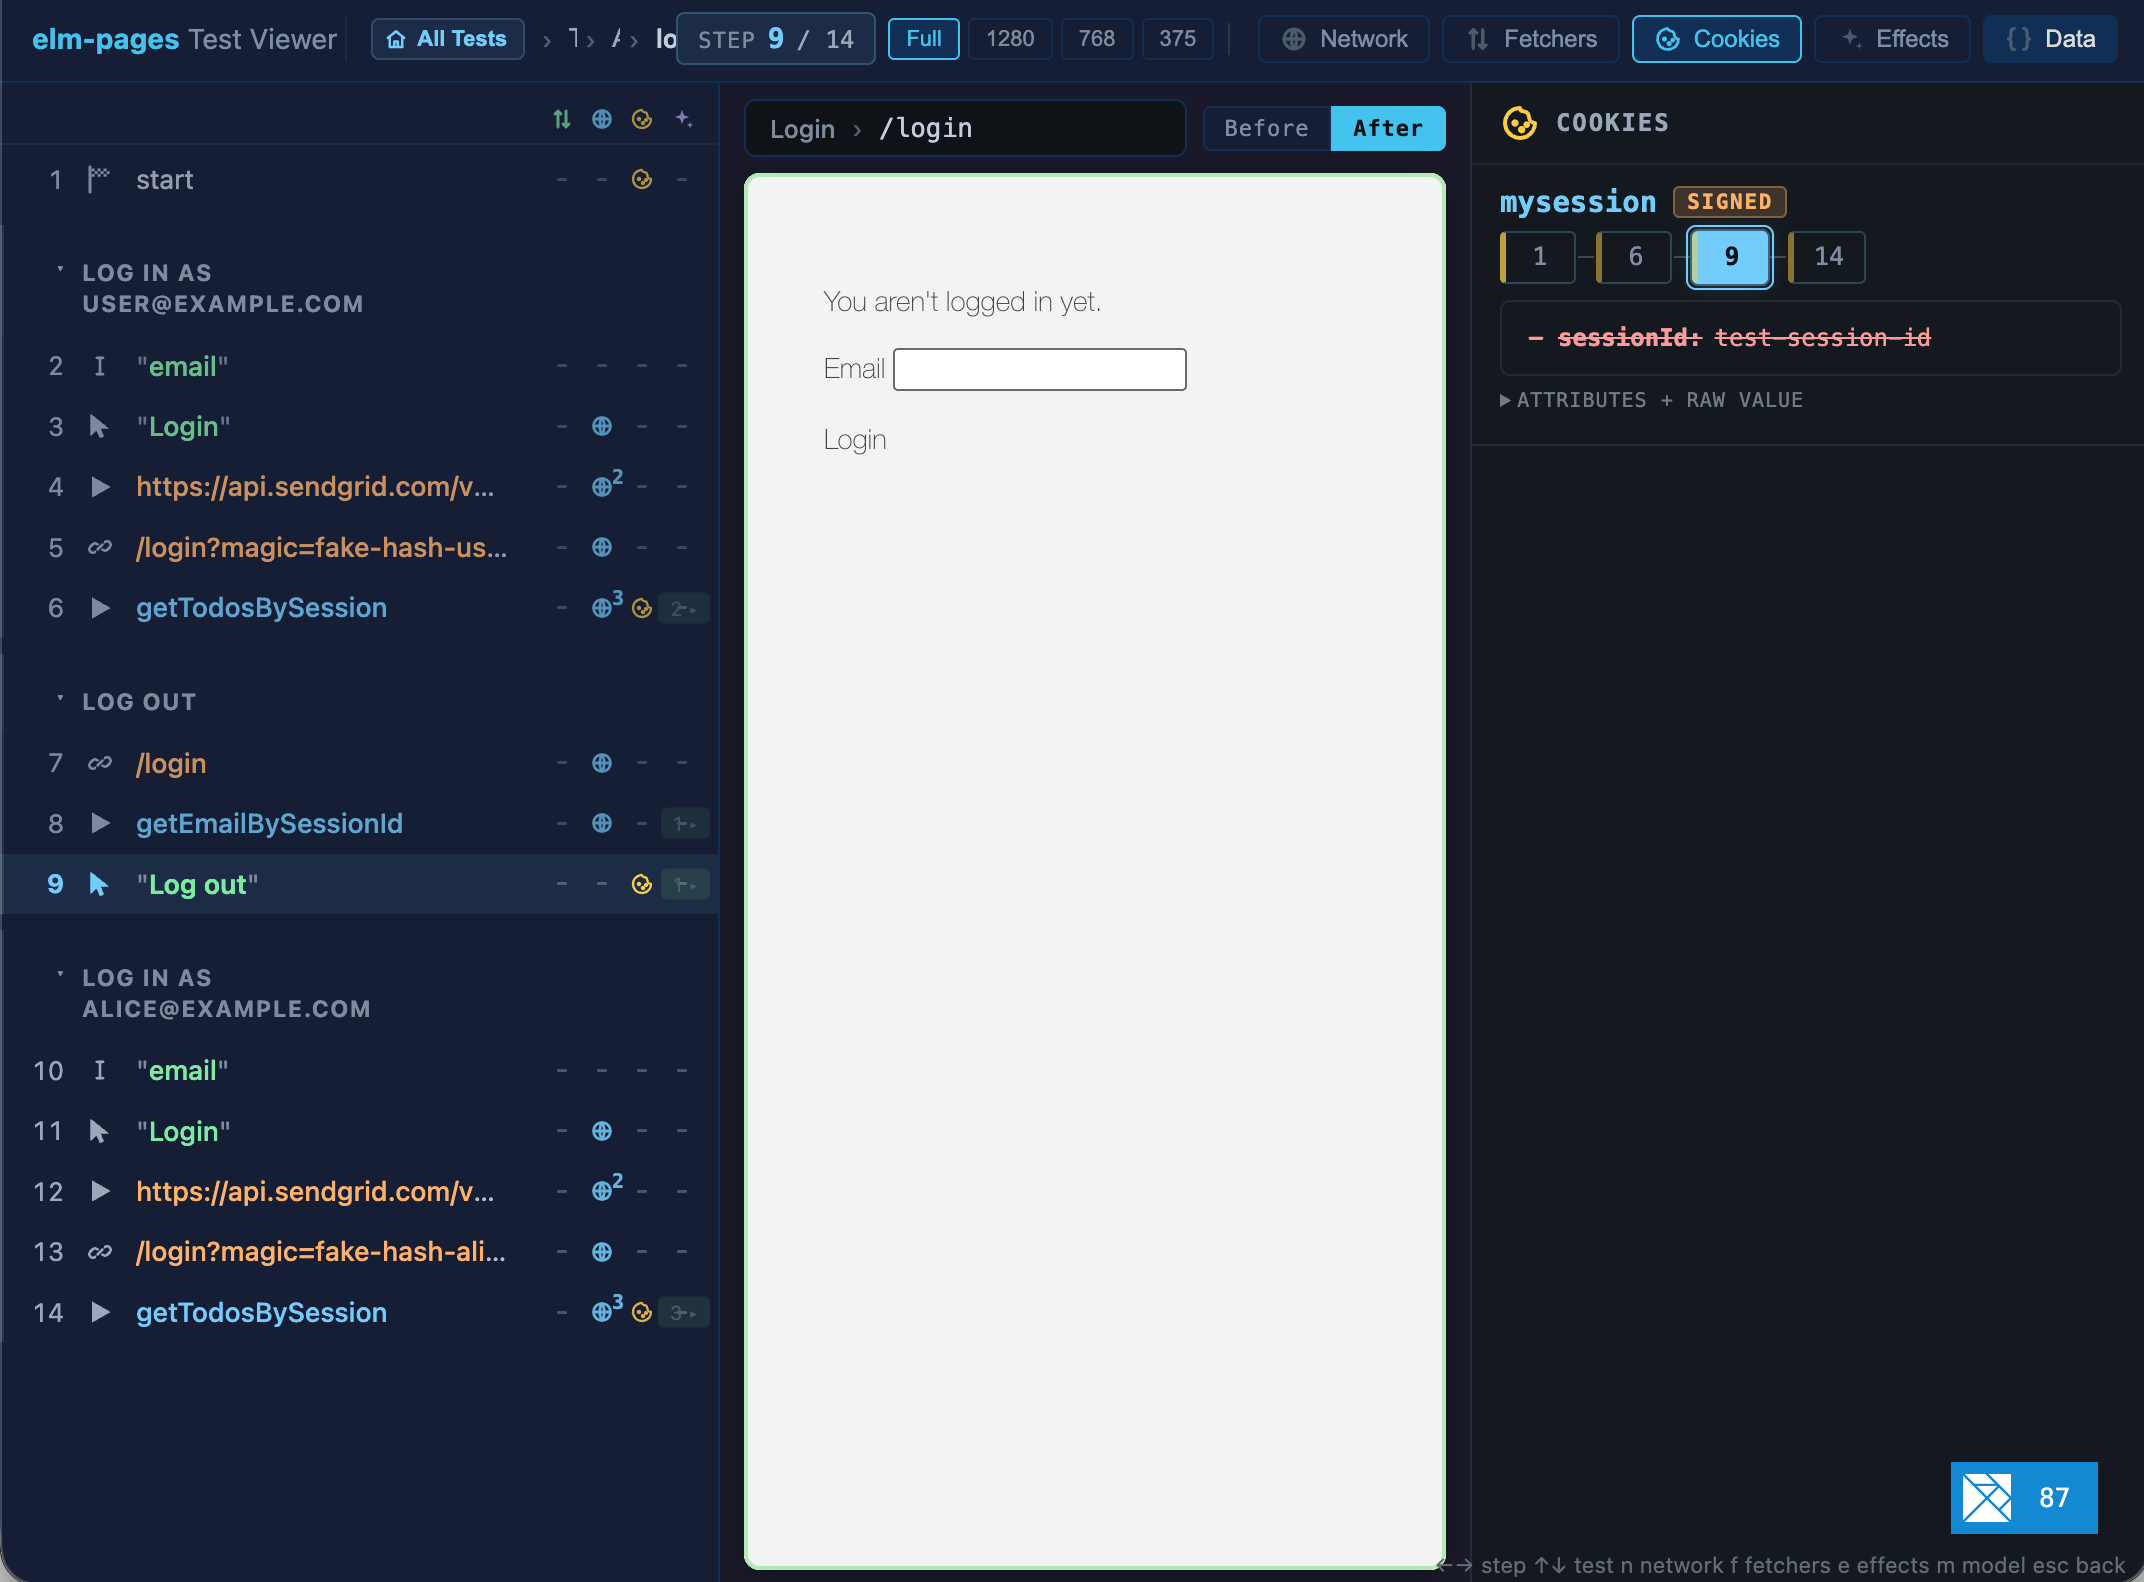
I'm showing a different example here that has more interesting cookie states. It does a full log in flow with two different accounts (with a log out in between).
There is a git-style diff shown. Here we can inspect what the sessionId field has changed from/to (it was removed) compared to the previous state it had (Step 6 since that is the previous Step Chip).
Data Tab
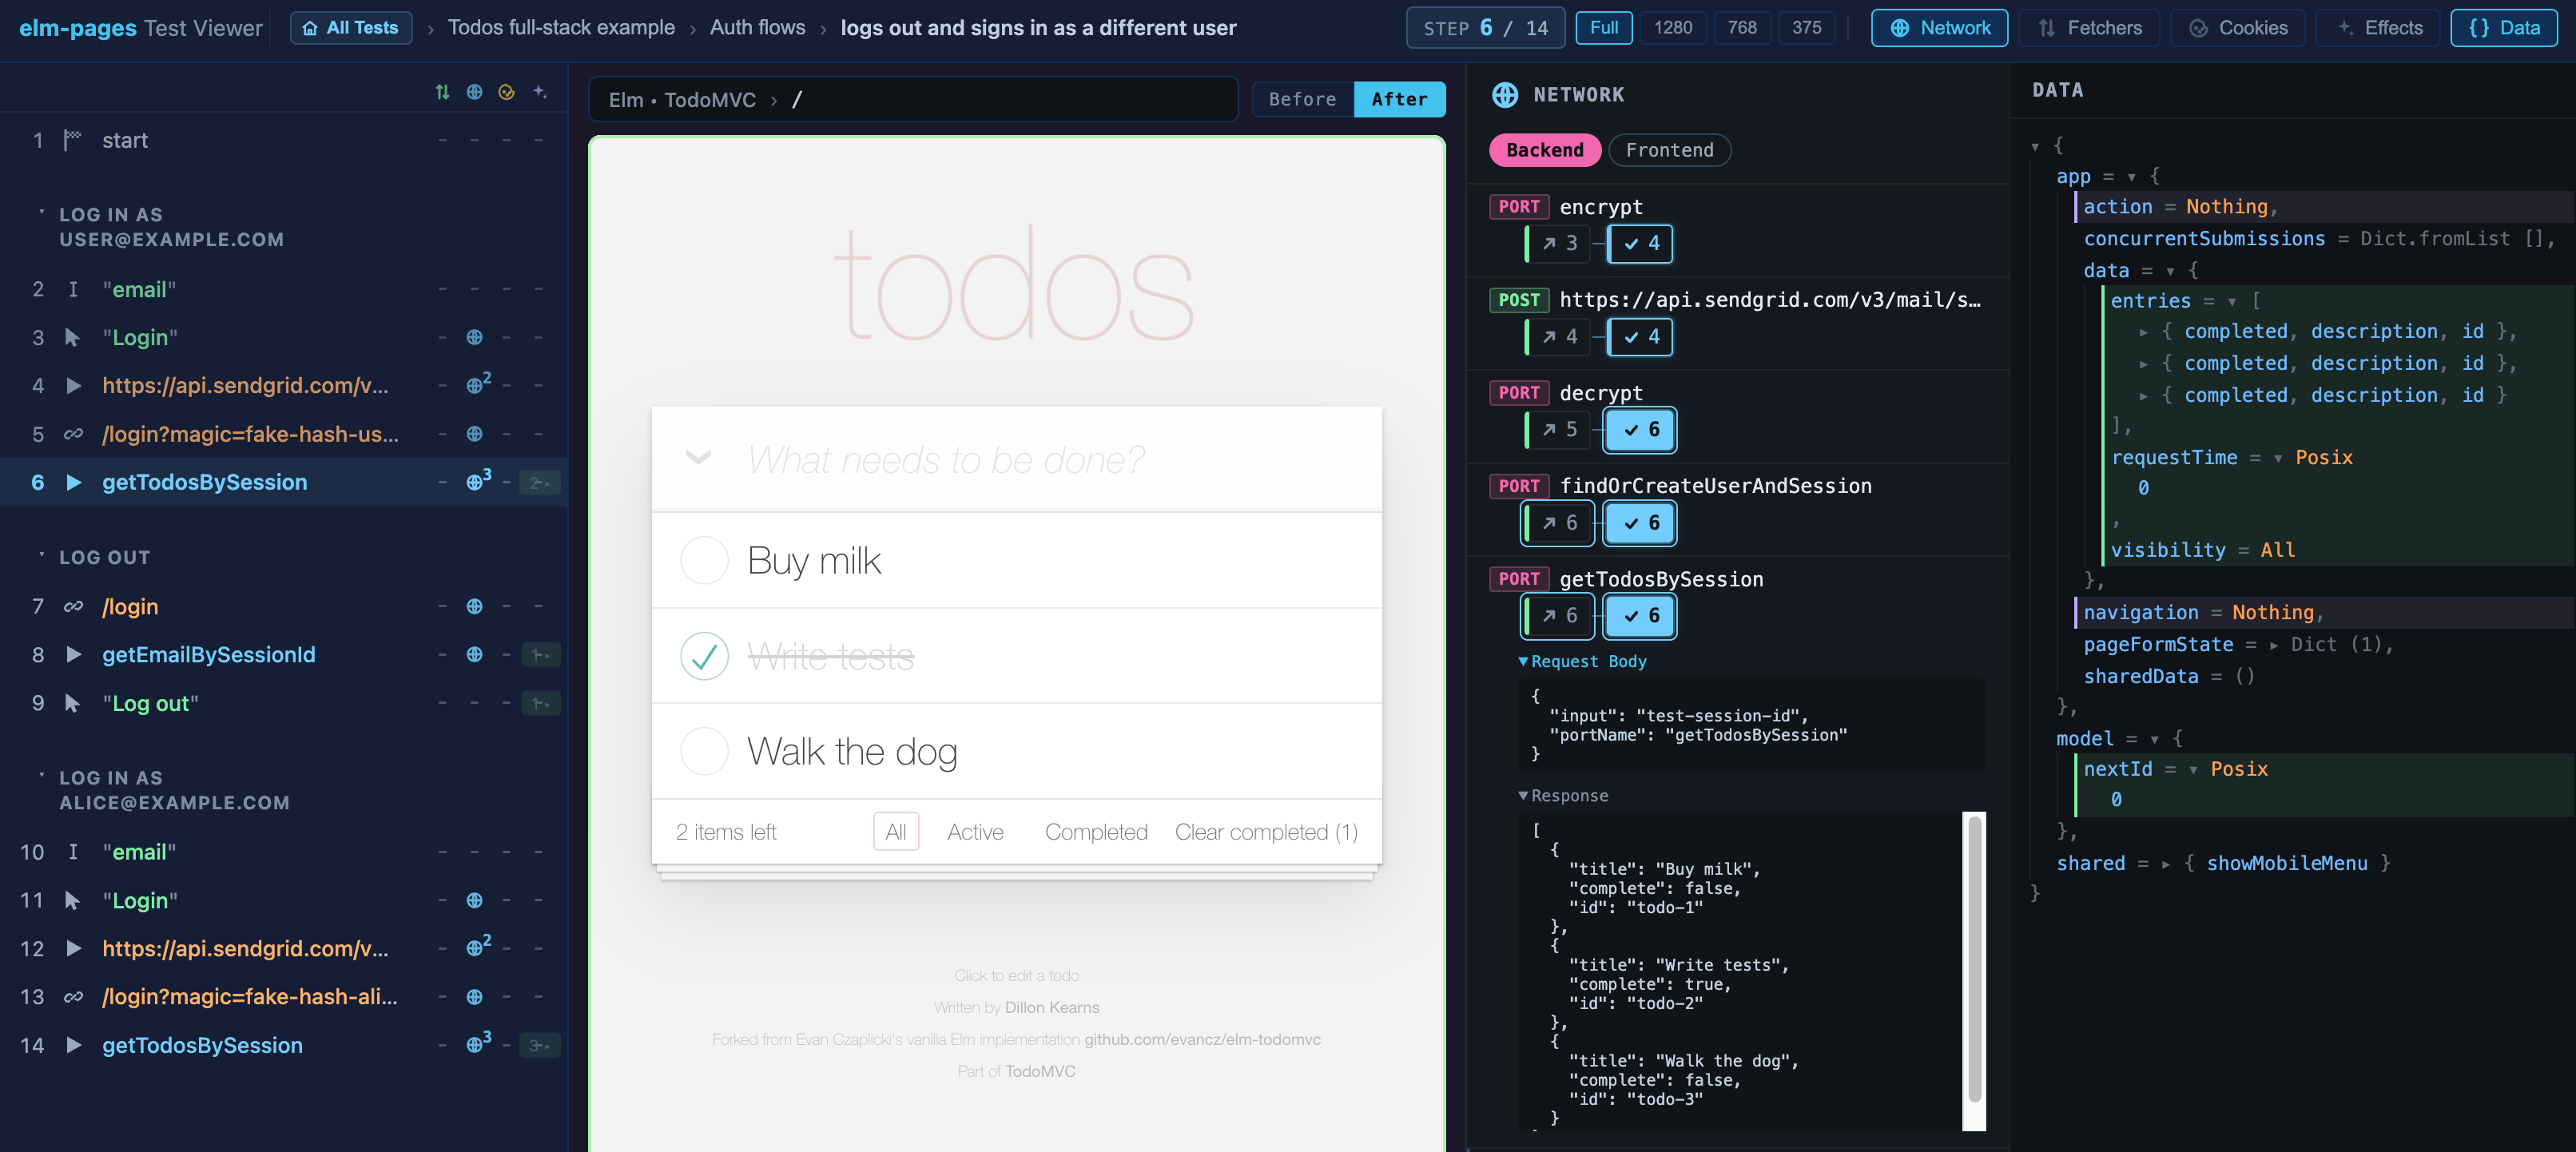
This lets you inspect your Route Module's resolved BackendTask and all other app state:
app(data,action,concurrentSubmissions, etc.)modelshared
You will see all of these values with their state at the step you are currently viewing. Plus navigating between steps will automatically expand and highlight changed values between steps.
In our log in/log out flow test case, you can see that our data changes after we log in. The auto-expanded changed values make it easy to see what is happening at each step, but you can also click and expand to dive into your app's resolved data at any stage.
Effects Tab
There is also an Effects tab. In elm-pages, your Route Modules' can run a client-side Effect, which is just like a vanilla Elm app's Cmd. I didn't show this tab off in this demo because in elm-pages apps I try to avoid using this, instead relying on the framework-level features. For example, instead of using elm/http to perform a client-side HTTP Effect, in our optimistic todo list example we fetch the initial data using a BackendTask and then update it using Fetchers. That said, if you do use Effects they will show up here!
Testing Pre-Rendered Routes
While this is most powerful for server-rendered routes (you can't access cookies or fetchers from pre-rendered routes, for example), the visual test debugger will still work for your pre-rendered routes and it can still be a valuable tool. There may be fewer edge cases for pre-rendered apps, but you may as well check your app once in an automated way and keep those tests around to avoid regressions in the future! At least that's why I love testing so much.
Try It Out
Effects as Data is what makes all of this possible, and I think it's one of the most promising opportunities for Elm-based frameworks and tools.
I think we can take this even further. Perhaps in the future I can explore "forking" test cases, an in-browser "record" feature à la Playwright that captures real Network responses, a visual BackendTask dependency graph viewer, or an integration with elm-form to inspect parsed form data. There are so many interesting possibilities left to explore, both in elm-pages and in the Elm ecosystem overall.
I hope you find this useful. If you give it a try, I would love to hear your thoughts on the Elm Slack or on the Incremental Elm Discord!